Programs for the calculation of the cost of manufacturing a mould of injection and the cost of the remaining piece
1 Need of the tools developed

Long times of realization
High investment
Obtaining pieces at the end of the process
Check of the success of the project at the end of the process
It can be said that in most cases the development of a piece or a set of plastic parts is a process that can initially begin with great uncertainties, both technical and economic. In an attempt to reduce to the maximum technical uncertainties can turn to experimentation with prototype parts or different programmes of simulation of rheological, durable and functional type, that handled by qualified persons can ensure the technical viability of the project. The two tools presented in this paper have been developed to reduce the uncertainties of economic. "Tool falls for the budget of injection of thermoplastic moulds" and "tool falls for economic optimization of injected plastic parts".
2 Tool falls for the budget of moulds

2.1 Method 1
The process of calculation using the first method is conceptually very simple. Through the programme can be stack molds appear where reflected their characteristics and costs data. The flow of work through the program could continue the following diagram (fig. 3).

2.2 Method 2
Method 2 is more complex in its implementation. The user must have a certain level of knowledge about injection moulds and must also have a first approach to the design of the mould. Data of departure for the implementation of the programme relating to their dimensions, materials, imprints, feeding, cooling systems, expulsion, movements and other elements that will bring the mold are needed. These data will be required by the programme during its implementation throughout the calculation of each of the subcoste in which the program divides the total cost of the mold. The program performs calculation based on these data and handles large database tatos information on materials for moulds and cost of standardized elements.
The flow of calculation recommended at the time of implementation of the programme is reflected in the following figure:

The results obtained by both methods can be stored according to the format of chips that manages the program in such a way that they move to expand the database of moulds.
For method 2 information obtained over the mold and the results are much broader. These can be broken down into materials and hours of work for each subcoste in different formats.

Method 2 uses equations to calculate the cost of parts in which the mold is divided for its calculation. Adjustment coefficients are used in these equations to ponder every influential factor and to be able to set the method to the production costs of each moldista. These costs were adjusted to a moldista through the analysis of the molds made for two years. Costs were studied both hours and materials of these moulds and General values of these coefficients which are which currently use the program but that they can be adjusted to any moldista were obtained from this study.

In order to apply the method 2 is needed a rough design of the mold, its structure, mechanisms and systems that compose. In the chart below we see the starting data used for the quote of a mold of a case of mirror for the automobile and the file of results obtained after the implementation of the programme.

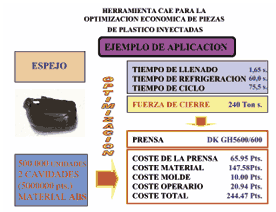
3 Tool falls for economic optimization of injected plastic parts
Cost of the material used
Cost of the used machine
Cost of depreciation of the repercutible the piece mould
Cost of the operator/s associated with the injection of the piece
To calculate these costs, the program uses databases of materials and machines in addition to required information characteristic of the piece and the mold must be entered by the user. Also calculates various parameters such as clamping force, times of cycle and makes an initial selection of the machines that can inject the piece. The scheme of work of the programme is reflected in the chart below.

Results

If we apply the program to the cast shown in the example above we get the results shown in Figure 10.